Assets and Liabilities
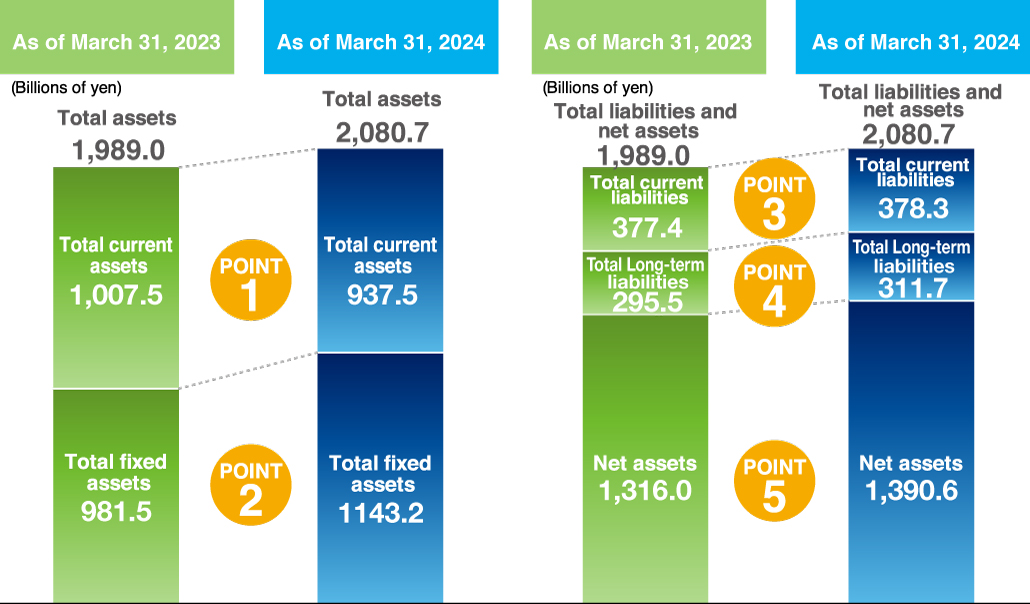
POINT1Graph
Total current assets, at 981.6 billion yen, were up 1.3% or 12.8 billion yen. This was largely attributable to the increases in securities by 32.9% or 11.4 billion yen to 46.3 billion yen, notes and accounts receivable – trade, and contract assets by 6.5% or 11.0 billion yen to 180.9 billion yen, and work in process by 105.0% or 7.2 billion yen to 14.1 billion yen, despite the decrease in cash and deposits by 3.4% or 13.7 billion yen to 394.9 billion yen.
POINT2Graph
Total non-current assets, at 1,248.4 billion yen, were up 6.1% or 71.7 billion yen. This was mainly attributable to the increases in investment securities by 10.4% or 45.1 billion yen to 480.8 billion yen, property, plant and equipment by 3.4% or 15.2 billion yen to 464.4 billion yen, and retirement benefit asset by 15.7% or 11.4 billion yen to 84.7 billion yen.
POINT3Graph
Total current liabilities amounted to 405.3 billion yen, up 6.9% or 26.0 billion yen, owing to the increase in notes and accounts payable – trade by 18.8% or 7.7 billion yen to 48.8 billion yen, income taxes payable by 24.4% or 6.3 billion yen to 32.1 billion yen, deposits received for cash collection and deposit services by 3.6% or 4.3 billion yen to 125.3 billion yen, and accrued consumption taxes by 42.7% or 4.0 billion yen to 13.6 billion yen.
POINT4Graph
Total non-current liabilities increased by 2.1% or 6.5 billion yen to 325.0 billion yen, compared to those at the end of the previous fiscal year, mainly attributable to the increases in reserve for contract of insurance by 1.4% or 2.5 billion yen to 192.9 billion yen and deferred tax liabilities by 9.9% or 2.5 billion yen to 27.8 billion yen.
POINT5Graph
Total net assets amounted to 1,499.6 billion yen, 3.6% or 51.9 billion yen higher than those at the end of the previous fiscal year, mainly due to the increases in retained earnings by 5.8% or 71.5 billion yen, valuation difference on available-for-sale securities by 69.0% or 26.6 billion yen, remeasurements of defined benefit plans by 58.0% or 4.3 billion yen, and non-controlling interests by 4.4% or 7.7 billion yen, despite the decrease in treasury shares by 33.9% of 59.9 billion yen.
Note: From the fiscal year ended March 31, 2025, the Company has partially revised the English labels of its financial statement accounts to conform with the EDINET Taxonomy provided by the Financial Services Agency. However, it should be noted that these revisions are superficial changes to the account labels and do not change their substance.