SECOM

Financial Data

Investor Relations

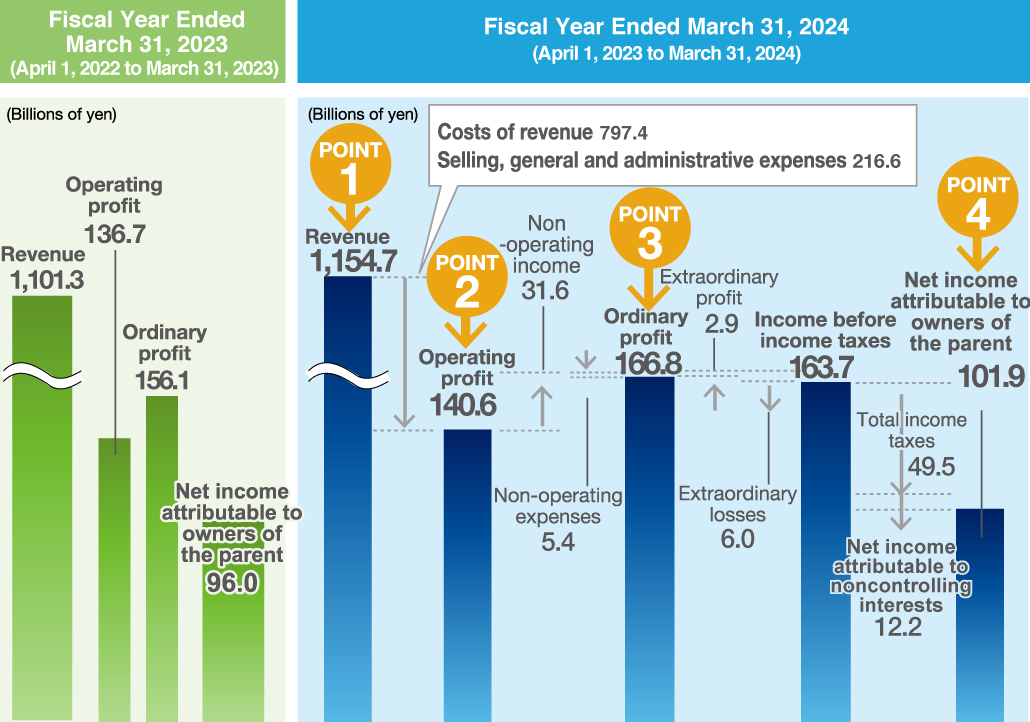
Net Sales and Profit

POINT1Graph

Consolidated net sales increased by 3.9% to 1,199.9 billion yen compared with the previous fiscal year, chiefly owing to the increases in revenue in security services, fire protection services and medical services.

POINT2Graph

Cost of sales increased by 3.9% to 828.7 billion yen, equivalent to 69.1% of net sales, the same ratio as in the previous fiscal year.
Selling, general and administrative (SG&A) expenses increased by 4.7% to 226.8 billion yen, equivalent to 18.9% of net sales, up from 18.8% in the previous fiscal year.
As a consequence, operating profit increased by 2.6% to 144.2 billion yen.

POINT3Graph

Ordinary profit increased by 5.0% to 175.1 billion yen, owing to the increase in non-operating income by 15.3% or 4.8 billion yen, mainly due to the increase in gain on investments in investment partnerships in the U.S. etc., despite the increase in non-operating expenses by 4.1% or 0.2 billion yen.

POINT4Graph

Total income taxes were 49.5 billion yen, equivalent to 28.3% of profit before income taxes, down from 30.3% in the previous fiscal year.
Profit attributable to non-controlling interests totaled 17.1 billion yen, increased by 40.3% or 4.9 billion yen.
As a result, profit attributable to owners of parent increased by 6.0% to 108.1 billion yen, equivalent to 9.0% of net sales, up from 8.8% in the previous fiscal year.

Note: From the fiscal year ended March 31, 2025, the Company has partially revised the English labels of its financial statement accounts to conform with the EDINET Taxonomy provided by the Financial Services Agency. However, it should be noted that these revisions are superficial changes to the account labels and do not change their substance.

Top